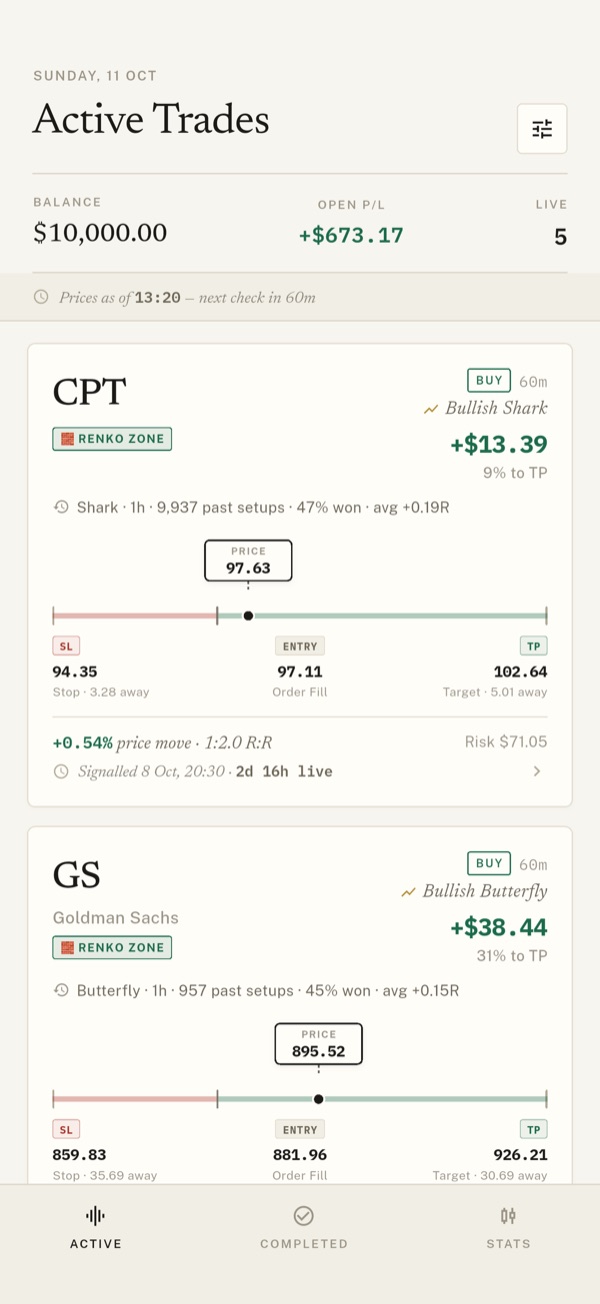
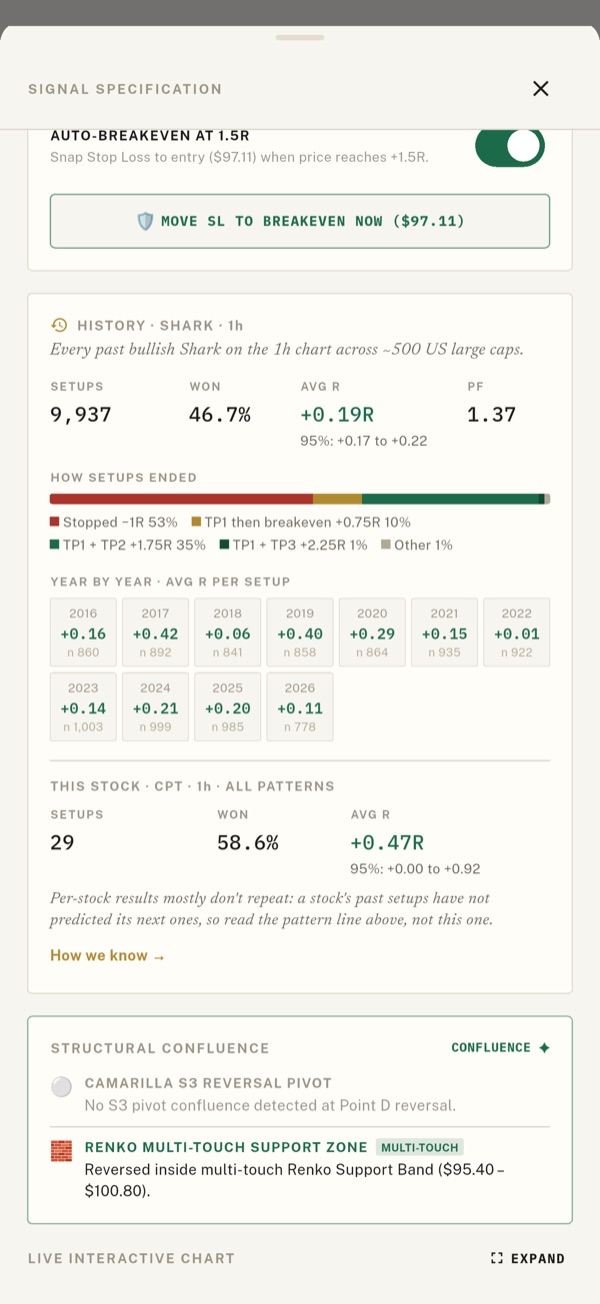
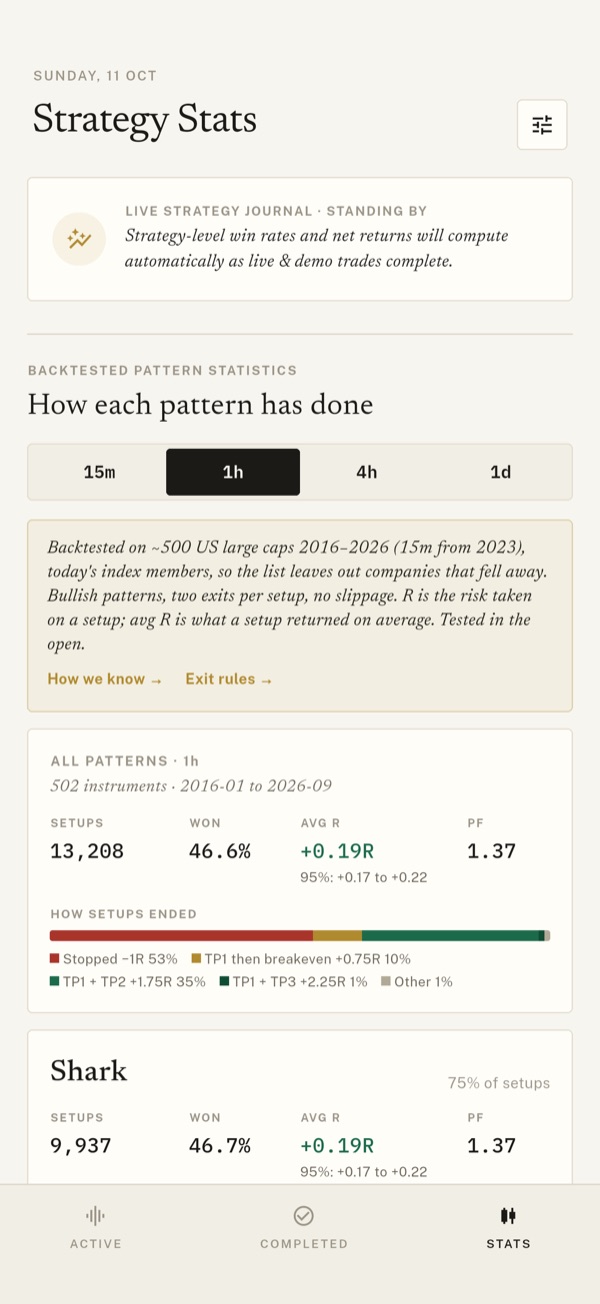
Every live signalEach pattern's recordStats by timeframe
Ten years of backtest on our watchlist
10.7 years2016–2026 backtest
−18%worst drawdown
81%of months up
Every yearpositive (worst: 2022, +26%)
Backtest of our watchlist, 2016–2026, including trading costs: 1,692 setups, starting from $10,000. The watchlist was chosen using this same history, and the account uses leverage (typically 2.3× its balance in open positions). These are not live results, and they will not repeat. Why a hand-picked backtest flatters results →
How it works
A pattern forms. The model scans our watchlist for completed harmonic patterns.
You get the alert. Entry, stop loss and two targets, worked out for you.
You follow it, risk-free. Set your simulated account size and risk per trade. Position sizes and P/L are calculated for you.
Every trade in the backtest, and every real trade since
All 1,692 setups behind the curve above, 2016–2026, with the harmonic pattern that triggered each one. From 29 September 2026 the list also has the strategy's real trades once they have closed. Each setup is two halves: one takes profit at 1.5R, the other runs to 2R or 3R, with the stop moved to entry once the first half has closed. R is the gain or loss as a multiple of the amount risked, after 0.1R of costs per trade.
The watchlist is part of the strategy
The strategy trades each asset only on specific timeframes. It sends signals for these 88 assets alone, each on the timeframes tagged next to it: 50 on 1 hour · 20 on 4 hour · 20 on daily (90 pairs in all). A pattern on any other asset or timeframe is not a signal. Win rate and average R are after costs. R:R (risk:reward) is the average winning trade divided by the average losing trade. Tap a column to sort, or a row to see its trades.
We picked these pairs because they were the best performers in this same backtest. That is why the list belongs to the strategy, and also why the backtest flatters it.
Entry times are London time; daily setups show the date only. "Closed" is the date the last half exited. Rows from 29 September 2026 on are the strategy's real trades, all closed, with the same 0.1R cost taken off as the backtest, so a full win shows +1.65R here and +1.75R on the track record. Trades still open are only in the app. Exit labels: TP1, TP2 and TP3 are profit targets, SL is the stop loss, BE is the stop at entry. Trading is high risk and most retail accounts lose money. Backtested results are not real trading results, and past performance does not guarantee future results. This is not financial advice.
Built on Open Harmonics
Trade Harmonics is based on the openharmonics.org project. The pattern rules, the code and every backtest are published there, including the experiments that didn't work. You can check the numbers yourself.
Get Trade Harmonics
Free. Sign in with Apple or Google, or look around first with the demo account.
Trade Harmonics is for education and information only. Signals are the output of a pattern-detection model, not financial advice or a recommendation to buy or sell any investment. Trading is high risk, especially spread betting and CFDs: leverage can make you lose more than your deposit, and most retail accounts lose money. Backtested and simulated results are not real trading results, and past performance, simulated or actual, does not guarantee future results.
 Trade Harmonics Every backtest trade ↓